- Navigate 3.1.4 LMS Reporting Quest

Consider the LMS explored during the Navigate skill. Then, in your blog, discuss the following: What are the options for grade reporting? Are there various levels? Which levels remain most valuable for the online instructor in regard to student performance?
Considering the 4 levels of grade reporting, we can look at each to analyze their value in regard to student performance. The 4 levels are outline below:
Student - I can impersonate a student to see what they see in the grade reporting. Their gradebook is shown in the format of categories. They can see the grade and the feedback on each assignment. As far as I know they do not have access to analytics, but they can see their grade average in each category. They do have to actually calculate this as it is given in the format of a percentage out of the weighted percent for that category.
This student has 48.52 out of 50. When you divide this you get 0.9704. That means that the student has a 97% in that category. So, this is not an area of weakness for this student.
This can give them insight into what particular category (daily, discussion, free response, quizzes, tests, labs, etc.) they need to work on.
Teacher - As teachers, we have access not only to the gradebook, but the analytics as well. Here is an example of how I have used analytics in my course.
Other examples of how I have used analytics can be located here: http://eportfolio-mcneill.weebly.com/data-analysis.html
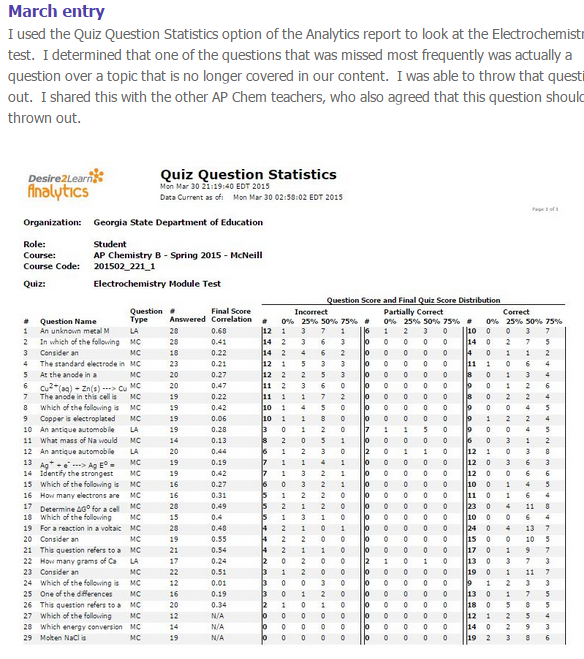
Course - Course level analytics are helpful to evaluate and re-design course materials and assessments. I have not specifically used analytics to evaluation my courses. But, I have used student feedback to do so. If I hear from multiple students that a particular topic was on a quiz or test was not covered in the content, I will research that situation to see if it is correct. If so, I can search by question to give those students credit back for those questions. I will them remove that question from the QL in my course and will fill out a course correction form to have this fixed in the master.
Program - Program level data is used to evaluate the effectiveness in aggregate of the successes and failures of programs to inform administrators of areas for improvement. This would be used by the administration. I am not familiar with exactly what analytics they use, but I do know that they have shared statistics with us at Professional Learning Symposiums. I am sure that these statistics were determined by their analytic access of data covering the entire student population.
